

Overview & System
1. Project Overview
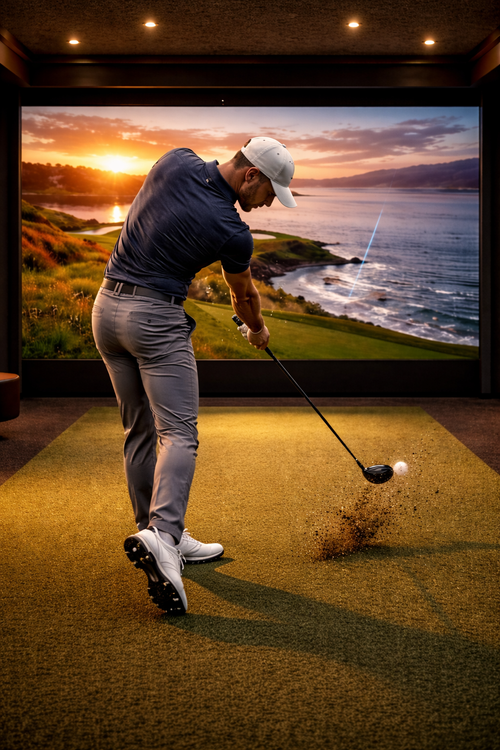
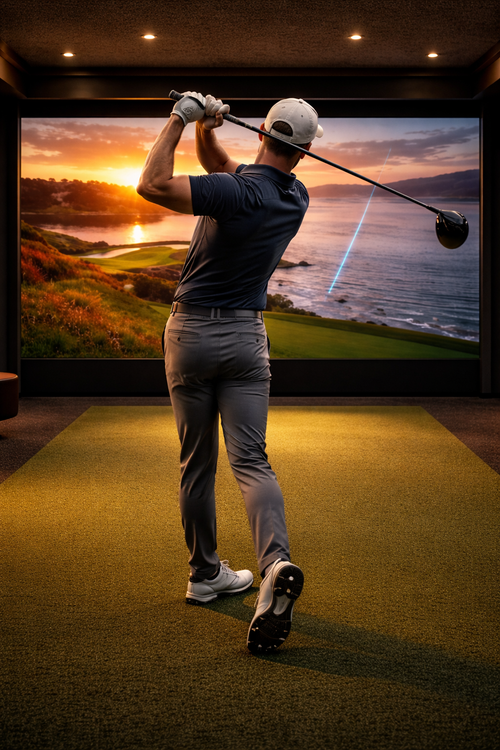
This proposal outlines the installation of a full scale, commercial grade golf simulator designed for paid training sessions. The system provides realistic ball flight, accurate feedback, and a professional indoor training environment suitable for golfers of all levels.
Project Overview Table
| Item | Description |
|---|---|
| Purpose | Install a full scale golf simulator for commercial training |
| Target Users | Golfers seeking realistic ball flight and coaching |
| Location | Indoor facility with 3–4m width and 2.5–3m height |
| Business Model | Paid 30‑minute training sessions |
2. System Components
The simulator includes high quality hardware and software selected for reliability, accuracy, and European warranty support. This ensures long term stability and eliminates overseas warranty risks.
System Components Table
| Component | Description |
|---|---|
| Enclosure | Full hitting bay with impact screen |
| Projector | Short‑throw, high brightness projector |
| Launch Monitor | European supported system such as SkyTrak or FlightScope |
| Hitting Mat | Commercial grade turf mat |
| Software | Course library and training modes |
| Warranty | Local European support and replacement parts |
Investment Cost Table
| Item | Estimated Cost |
|---|---|
| SimSpace Complete Enclosure | €900 – €1,500 |
| BenQ AH500ST Projector + Floor Case | €1,800 – €2,200 |
| GC3 Launch Monitor | €4,000 – €5,000 |
| Premium Hitting Mat (Fiberbuilt / SIGPro) | €400 – €900 |
| GSPro Software | €250 / year |
| Optional: Landing Turf / Ball Tray | €50 – €150 |
| Total Investment (Complete System) | €8,000 – €11,000 |
4. Pricing Model
Each training session lasts 30 minutes and includes approximately 25–30 balls. The simulator operates 8 hours per day and 6 days per week.
Pricing Model Table
| Item | Value |
|---|---|
| Price per session | 30 EUR |
| Session duration | 30 minutes |
| Sessions per hour | 2 |
| Hours per day | 8 |
| Days per week | 6 |
Revenue & ROI
5. Additional Revenue Services (Optional)
These optional services can be offered alongside simulator training. They are not required for every customer and serve as flexible add ons that increase total revenue per client while enhancing the overall golf improvement experience.
Additional Services Pricing Table
| Service | Description | Price |
|---|---|---|
| Golf Fitness Advice | Targeted fitness guidance focused on mobility, stability, and golf‑specific movement patterns | 15 EUR |
| Golf Performance Core Integrity | Focused core activation and stability training designed to improve swing control and power | 15 EUR |
6. Revenue Calculations at Full Capacity
This section calculates revenue assuming every 30‑minute session is booked.
Full Capacity Revenue Table
| Period | Revenue |
|---|---|
| Daily | 480 EUR |
| Weekly | 2880 EUR |
| Monthly | 12470 EUR |
| Yearly | 149640 EUR |
7. Revenue Range Scenarios
This section shows realistic revenue ranges based on different usage levels.
Monthly Revenue Range Table
| Usage Level | Sessions per Day | Monthly Revenue |
|---|---|---|
| Low Usage | 5–7 | 3900–5400 EUR |
| Normal Usage | 10–12 | 7800–9300 EUR |
| Full Capacity | 16 | 12000–12500 EUR |
8. Return on Investment
Using a mid‑range investment of 15000 EUR, the simulator reaches break‑even quickly.
ROI Table
| Usage Level | Monthly Revenue | Break‑Even Time |
|---|---|---|
| Full Capacity | 12000–12500 EUR | 1.2 months |
| Normal Usage | 7800–9300 EUR | 1.6–2 months |
| Low Usage | 3900–5400 EUR | 3–4 months |
9. Final Statement
The golf simulator represents a high‑value, low‑risk investment with rapid break‑even potential and strong recurring revenue. With proper marketing and consistent customer experience, it can become a stable and profitable long‑term business asset.